Troubleshoot Control Center for Confluent Platform
Common issues
View processing status in Control Center
View a high-level summary of running and processing status within the Control Center application. Check the status at any time.
In the upper-right corner of Control Center, click the menu icon to open the Administration menu.
Click About Control Center.
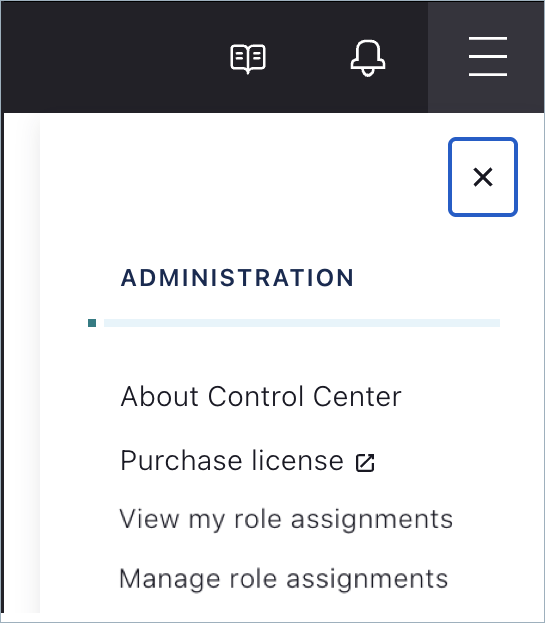
Processing Status shows the status of Control Center (Running or Not Running). Consumption data and Broker data message processing speeds are shown in real-time since 30 minutes ago.

Installing and Setup
If you encounter issues during installation and setup, you can try these solutions.
Bad security configuration
Check the security configuration for all brokers, Telemetry Reporter, and Control Center (see debugging check configuration). For example, is it SASL_SSL, SASL_PLAINTEXT, SSL?
Possible errors include:
ERROR SASL authentication failed using login context 'Client'. (org.apache.zookeeper.client.ZooKeeperSaslClient)
Caused by: org.apache.kafka.common.KafkaException: java.lang.IllegalArgumentException: No serviceName defined in either JAAS or Kafka configuration
org.apache.kafka.common.errors.IllegalSaslStateException: Unexpected handshake request with client mechanism GSSAPI, enabled mechanisms are [GSSAPI]
Verify that the correct Java Authentication and Authorization Service (JAAS) configuration was detected.
If ACLs are enabled, check them.
To verify that you can communicate with the cluster, try to produce and consume using
console-*with the same security settings.
InvalidStateStoreException
- This error usually indicates that data is corrupted in the configured
confluent.controlcenter.data.dir. For example, this can be caused by an unclean shutdown. To fix, give Control Center a new ID by changingconfluent.controlcenter.idand restart. - Allow permission for the configured
confluent.controlcenter.data.dir.
Not enough brokers
Check the logs for the related error not enough brokers. Verify the topic replication factors are set correctly and verify that there are enough brokers available.
Local store permissions
Check the local permissions in Control Center state directory. These settings are as defined in the config confluent.controlcenter.data.dir in the control-center.properties. You can access that directory with the user ID that was used to start Control Center.
Multiple instances of Control Center have the same ID
You must use unique IDs for each Control Center instance, including instances in Docker. Duplicate IDs are not supported and will cause problems.
License expired
If you see a message similar to this:
[2017-08-21 14:12:33,812] WARN checking license failure. contact `support@confluent.io <mailto:support@confluent.io>`_ for a license key: Unable to process JOSE object (cause: org.jose4j.lang.JoseException: Invalid JOSE….
You should verify that the user has a valid license, as specified in confluent.license=<your key>. This can be either the key or a path to a license file.
For more information, see the Control Center configuration documentation. To manage a license in
the Control Center web interface, see Manage Confluent Platform Licenses Using Control Center.
A schema for message values has not been set for this topic
If you encounter this error message, you should verify that the Schema Registry listeners=http://0.0.0.0:8081 configuration
matches the Control Center confluent.controlcenter.schema.registry.url=http://localhost:8081 configuration. For more
information, see Manage Control Center Logs for Confluent Platform.
Control Center cannot connect to Confluent Cloud
When attempting to connect a Confluent Cloud cluster to Control Center (following the Connecting Control Center to Confluent Cloud procedure), you see a message similar to the following:
[2019-07-31 20:40:28,023] ERROR [main] attempt=failed to create topic=TopicInfo{name=_confluent-metrics, partitions=12, replication=3} (io.confluent.controlcenter.KafkaHelper)
org.apache.kafka.common.errors.PolicyViolationException: Config property 'max.message.bytes' with value '10485760' exceeded max limit of 8388608.
The error message max.message.bytes is due to enforcement on some default
settings on Confluent Cloud.
To resolve the error, add the following configuration to the Control Center properties file and restart Control Center:
...
confluent.metrics.topic.max.message.bytes=8388608
...
This mismatch in default values between Control Center and Confluent Cloud is a known issue being tracked in MMA-3564.
Cannot browse topic messages using Safari and authentication
Due to a WebKit bug in Safari, the following unknown error displays when using authentication and attempting to browse topic messages:
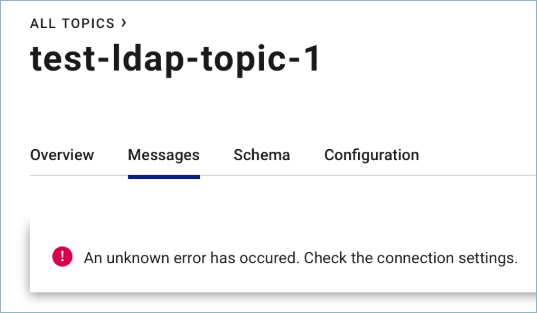
The Safari browser fails to send authenticated requests through the WebSocket protocol.
The recommended workaround in the interim is to use the Chrome or Firefox browsers rather than Safari.
System health
Web interface that is blank or stuck loading
If you experience a web interface that is blank or stuck loading, you can select the cluster in the drop-down and use the information below to troubleshoot.
Are there errors or warnings in the logs? For more information on how to find logs, see the documentation.
What are you monitoring? Are you under-provisioned?
Is there a lag in Control Center?
Use browser debugging tools to check REST calls to find out if the requests have been made successfully and with a valid response, specifically these requests:

Tip
You can view these calls by using common web browser tools (e.g., Chrome Developer Tools).
The
/3.0/metrics/<cluster-id>/maxtimeendpoint should return the latest timestamp that Control Center has for metrics data.If no data is returned from the backend, verify that you’re getting data on the input topic and review the logs for issues.
The Control Center is getting ready to launch
If this message appears in the web interface after starting or restarting Control Center, click Try again.
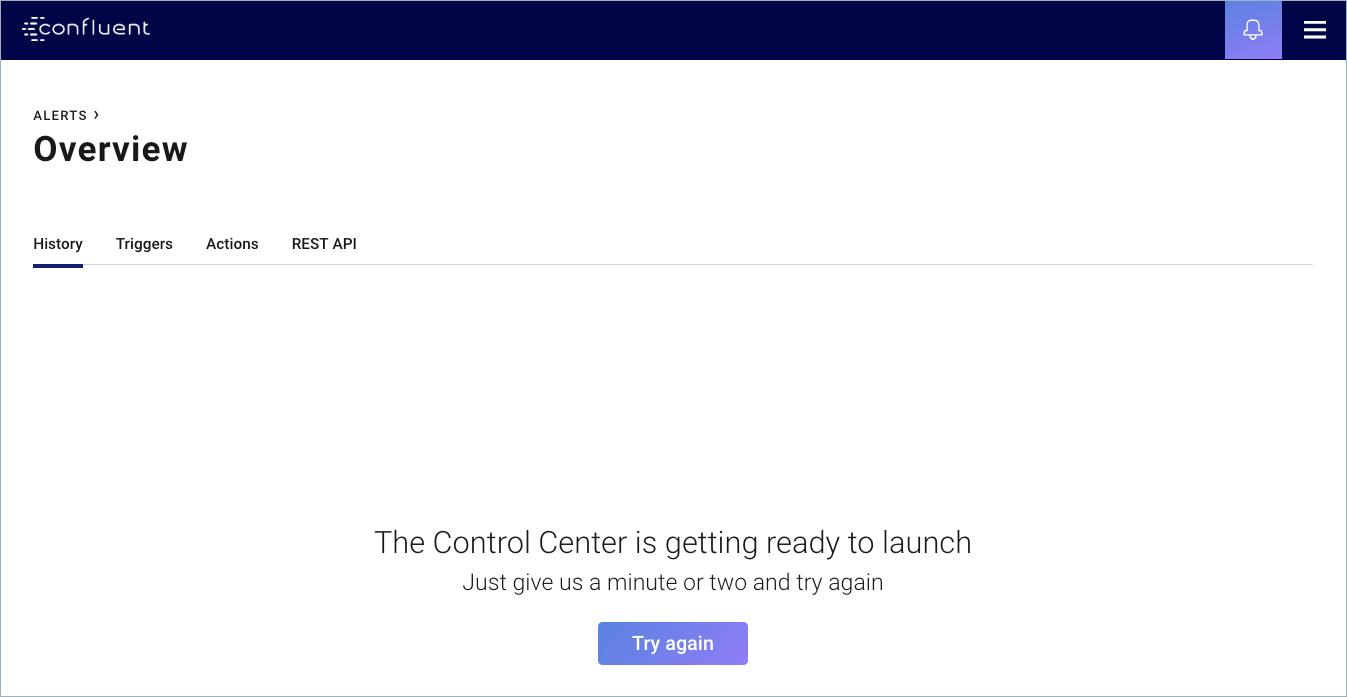
If Control Center doesn’t launch, try the suggestions below to troubleshoot:
- Usually this means that Apache Kafka® doesn’t have any metrics data, but this message could also indicate a 500 Internal Server Error has occurred. If you get a 500 error, check the Control Center logs for errors.
- Use browser debugging tools to check the response. An empty
response (
{ }) from the/3.0/metrics/<cluster-id>/maxtimeendpoint means that Kafka hasn’t received any metrics data. - Verify that the Telemetry Reporter is set up correctly.
- Check Prometheus.
No clusters found
If a message appears in the web interface saying No clusters found after starting
Control Center, check your configuration in the
appropriate control.center.properties
file.
Control Center cannot start due to temporary directory permissions
Issue: Get an error about /tmp mounted with noexec:
java.lang.UnsatisfiedLinkError: /tmp/librocksdbjni3375578050467151433.so:
/tmp/librocksdbjni3375578050467151433.so: failed to map segment from shared object:
Operation not permitted when /tmp is mounted with noexec
Resolution: If you do not have write access to the /tmp directory because it is set to noexec, pass in
a directory path for rocksdbtmp that you have write access to and start Control Center.
CONTROL_CENTER_OPTS="-Djava.io.tmpdir=/my/dir/for/rocksdbtmp" control-center-start /path/to/control-center.properties
Nothing is produced on the Metrics (_confluent-metrics) topic
- Verify that Telemetry Reporter is set up correctly with security configured.
- Check the Kafka broker logs and look for timeouts or other errors (e.g., RecordTooLargeException)
Parts of the broker or topic table have blank values
This is a known issue that should be transient until Control Center is caught up. It can be caused by Control Center lagging or having trouble keeping up due to lack of resources.
RBAC
Max requests queued per destination 1024 exceeded
This is a rare issue that occurs due to the interaction of the custom MDS client used with Control Center when RBAC is enabled. If you receive this error, try the following:
- Restart Control Center if possible
- Increase the
confluent.controlcenter.mds.client.max.requests.queued.per.destinationconfiguration value and lower theconfluent.controlcenter.mds.client.idle.timeoutvalue. For more, see RBAC settings.
Connect
The Control Center is getting ready to launch
If this message appears in the web interface, use the information below to troubleshoot.
- Is the Connect cluster that is defined in
confluent.controlcenter.connect.clusteravailable? - Can you reach the Connect endpoints directly by running a cURL command (e.g.,
curl www.example.com)? - Check the Connect logs for any errors. Control Center is a proxy to Connect.
Control Center troubleshooting
Control Center is not starting up
Check log files for error. If you see streams related errors, try resetting Control Center Id and restarting. For more information, see How to reset Confluent Control Center
Prometheus or Alertmanager show “Not Running” in the user interface
Check if Prometheus and Alertmanager are running:
ps aux | grep prometheus
ps aux | grep alertmanager
Check if Prometheus and Alertmanager are healthy
Prometheus GET http(s)://c3-hostname:9090/-/healthy
Alertmanager GET http(s)://c3-hostname:9093/-/healthy
Check log files in case of Confluent Ansible and manual deployment. For CFK, logs are present in support bundle.
Prometheus /var/log/confluent/control-center/prometheus.log
Alertmanager /var/log/confluent/control-center/alertmanager.log
Prometheus or Alertmanager won’t start
Check if Prometheus and Alertmanager are running:
ps aux | grep prometheus
ps aux | grep alertmanager
Check log files in case of Confluent Ansible and manual deployment. For CFK, logs are present in support bundle.
Prometheus /var/log/confluent/control-center/prometheus.log
Alertmanager /var/log/confluent/control-center/alertmanager.log
Control Center shows metrics not available with running and healthy Prometheus
This error is displayed when brokers are not emitting metrics or Prometheus is not receiving metrics from brokers.
Check if brokers are configured to export metrics to Prometheus.
Broker configurations (server.properties) should have all the configurations specified in the multi-node manual installation. For more information, see Confluent Control Center Installation.
Check if brokers are able to resolve Control Center endpoint:
curl -X POST http(s)://c3-host:9021/api/v1/otlp/v1/metrics
Tip
If you’re using https, you need to pass the cert as well.
Check for errors in the Prometheus logs.
- For CFK install, logs are present in support bundle.
For Confluent Ansible or manual install, find log path using this:
ps aux | grep prometheus
Stale metrics in Prometheus
Check if brokers are configured to export metrics to Prometheus.
Broker configurations (server.properties) should have all the configurations specified in the multi-node manual installation. For more information, see Confluent Control Center Installation.
Check if brokers are able to resolve Control Center endpoint:
curl -X POST http(s)://c3-host:9021/api/v1/otlp/v1/metrics
Tip
If you’re using https, you need to pass the cert as well.
Check for errors in the Prometheus logs.
- For CFK install, logs are present in support bundle.
For Confluent Ansible or manual install, find log path using this:
ps aux | grep prometheus
Broker Count and Partition Count are missing in KRaft Mode
Check if KRaft controllers are configured to export metrics to Prometheus.
Broker configurations should have all the configurations specified in the multi-node manual installation. For more information, see Confluent Control Center Installation.
Check if controllers are able to resolve Control Center endpoint:
curl -X POST http(s)://c3-host:9021/api/v1/otlp/v1/metrics
Tip
If you’re using https, you need to pass the cert as well.
Check for errors in the Prometheus logs.
- For CFK install, logs are present in support bundle.
For Confluent Ansible or manual install, find log path using this:
ps aux | grep prometheus
Alerts not triggered
Check if alert condition if triggered in Prometheus user interface:
http://c3-host:9090/alerts
Check if Alertmanager user interface shows the alert:
http://c3-host:9093/#/alerts
Check log files in case of Confluent Ansible or manual deployment at location
Prometheus:
/var/log/confluent/control-center/prometheus.log
Alertmanager:
/var/log/confluent/control-center/alertmanager.log
Error message in Prometheus log
You see this message in the Prometheus log:
:time=2024-12-19T13:41:57.309-05:00 level=WARN source=write_handler.go:520 msg="Error translating OTLP metrics to Prometheus write request" component=web
err="the following errors occurred:\n - invalid temporality and type combination for metric \"io.confluent.kafka.server/request/queue_size/delta\"\n -
invalid temporality and type combination for metric \"io.confluent.kafka.server/request/response_queue_time_ms/time/delta\"\n - invalid temporality and
type combination for metric \"io.confluent.kafka.server/request/response_queue_time_ms/total/delta\"\n - invalid temporality and type combination for me
tric \"io.confluent.kafka.server/request/health_check_total_time_ms/time/delta\"\n - invalid temporality and type combination for metric \"io.confluent.
kafka.server/request/health_check_total_time_ms/total/delta\"\n
Non-supported metric type have been whitelisted with the confluent.telemetry.exporter._c3.metrics.include configuration. Update your
broker and KRaft controller configurations using the recommendations in the installation topic. For more information, see Confluent Control Center Installation.
After broker recovery, you see negative number of out-of-sync replicas
You may see negative numbers of out-of-sync replicas after a broker starts up again. The metrics may take about two minutes to return to the correct state.
Debugging
Check logs
These are the Control Center log types. For more information about logging, see Manage Control Center Logs for Confluent Platform.
control-center.log- Control Center, HTTP activity, anything not related to streams, REST API callscontrol-center-streams.log- Streamscontrol-center-kafka.log- Client, ZooKeeper, and Kafka
Here are things to look for in the logs:
ERRORshutdownExceptions- verify that the brokers can be reachedWARNHealthcheckerrors and warnings
If nothing is obvious, turn DEBUG logging on and restart Control Center.
Enable debug and trace logging
Open the
CONFLUENT_HOME/etc/confluent-control-center/log4j.propertiesfile. This file is referenced by theCONTROL_CENTER_LOG4J_OPTSenvironment variable.Set and export the
CONTROL_CENTER_LOG4J_OPTSenvironment variable similar to this example:export CONTROL_CENTER_LOG4J_OPTS='-Dlog4j.configuration=file:/apps/kafka/config/confluent-control-center/log4j.properties'
Set your debugging options:
To enable debug logging, change the log level to
DEBUGat the root level:log4j.rootLogger=DEBUG, stdout
To enable trace logging, change the root logger to
TRACEat the root level:log4j.rootLogger=TRACE, stdout
To enable additional streams logging, particularly at the request of Confluent Support, follow this example:
log4j.rootLogger=DEBUG, stdout

log4j.appender.stdout=org.apache.log4j.ConsoleAppender
log4j.appender.stdout.layout=org.apache.log4j.EnhancedPatternLayout
log4j.appender.stdout.layout.ConversionPattern=[%d] %p [%t] %m (%c)%n

log4j.appender.streams=org.apache.log4j.ConsoleAppender
log4j.appender.streams.layout=org.apache.log4j.EnhancedPatternLayout
log4j.appender.streams.layout.ConversionPattern=[%d] %p [%t] %m (%c)%n
log4j.appender.streams.filter.1=io.confluent.Log4jRateFilter

# Allows everything that is greater than or equal to specified level
log4j.appender.streams.filter.1.level=TRACE
# Allows rate/second logs at less than specified level
#log4j.appender.streams.filter.1.rate=25

log4j.logger.org.apache.kafka.streams=INFO, streams
log4j.additivity.org.apache.kafka.streams=false
log4j.logger.io.confluent.controlcenter.streams=INFO, streams
log4j.additivity.io.confluent.controlcenter.streams=false

log4j.logger.kafka=ERROR, stdout
log4j.logger.org.apache.kafka=ERROR, stdout
log4j.logger.org.apache.kafka.clients.consumer=INFO, stdout
log4j.logger.org.apache.zookeeper=ERROR, stdout
log4j.logger.org.I0Itec.zkclient=ERROR, stdout
Restart Control Center. For more information, see Control Center Configuration Examples for Confluent Platform.
./bin/control-center-stop
./bin/control-center-start ../etc/confluent-control-center/control-center.properties
When you are done debugging and tracing, reset the log levels back to their defaults and restart Control Center:
log4j.rootLogger=INFO, stdout

log4j.appender.stdout=org.apache.log4j.ConsoleAppender
log4j.appender.stdout.layout=org.apache.log4j.EnhancedPatternLayout
log4j.appender.stdout.layout.ConversionPattern=[%d] %p [%t] %m (%c)%n

log4j.appender.streams=org.apache.log4j.ConsoleAppender
log4j.appender.streams.layout=org.apache.log4j.EnhancedPatternLayout
log4j.appender.streams.layout.ConversionPattern=[%d] %p [%t] %m (%c)%n
log4j.appender.streams.filter.1=io.confluent.Log4jRateFilter
# will allow everything that is >=level
log4j.appender.streams.filter.1.level=WARN
# will only allow rate/second logs at <level
log4j.appender.streams.filter.1.rate=25

log4j.logger.org.apache.kafka.streams=INFO, streams
log4j.additivity.org.apache.kafka.streams=false
log4j.logger.io.confluent.controlcenter.streams=INFO, streams
log4j.additivity.io.confluent.controlcenter.streams=false

log4j.logger.kafka=INFO, stdout
log4j.logger.org.apache.kafka=INFO, stdout
log4j.logger.org.apache.kafka.clients.consumer=INFO, stdout
log4j.logger.org.apache.zookeeper=WARN, stdout
log4j.logger.org.I0Itec.zkclient=WARN, stdout
Check configurations
Is security enabled? Check the security configuration settings on the broker, clients, and Control Center.
Verify that the prefixes are correct.
Verify the topic configurations for all Control Center topics: replication factor, timestamp type, min isr, and retention.
./bin/kafka-topics --bootstrap-server <host:port> --describe
Size of clusters
For examples on how to size your environment, review the Control Center example deployments.
System check
Check the system level metrics where Control Center is running; including CPU, memory, disk, and JVM settings. Are the settings within the recommended values?
Frontend request and response
Using your browser’s web developer tools, view Network settings to verify that requests and responses are showing the correct data.
If you are working with Confluent Support to debug browser issues, they may ask you to capture a HAR file for them to review. HAR files store all requests/responses between the browser and the server.
For example, to generate the HAR file with Google Chrome:
- Open Google Chrome and go to the page where the issue is occurring.
- From the Chrome menu bar, select View > Developer > Developer Tools.
- In the Developer Tools panel, select the Network tab.
- Look for a round red Record button in the upper left corner of the tab and confirm that it is red (activated). If it is grey, click it once to start recording.
- Check the Preserve log box to preserve capture across multiple pages.
- Reproduce the issue in the browser by interacting with the page.
- Right-click anywhere on the grid of network requests, select Save as HAR with content, and save the file.
You can upload the HAR file to your Confluent Support ticket (or review the contents of the file if you are doing your own troubleshooting).

Tip
You can also right-click any row in the developer tools panel and select Copy > to copy Network log content as a HAR or cURL file.
REST API
Backend REST API calls are logged in c3.log.
Enable GC logging
Enable GC logs, restart Control Center with the following, where directory (<dir>) is specified:
CONTROL_CENTER_JVM_PERFORMANCE_OPTS="-server -verbose:gc -Xloggc:<dir>/gc.log -XX:+UseParNewGC -XX:+UseConcMarkSweepGC -XX:+CMSClassUnloadingEnabled -XX:+CMSScavengeBeforeRemark -XX:+DisableExplicitGC -XX:+PrintGCDetails -XX:+PrintGCTimeStamps -XX:+PrintGCCause -Djava.awt.headless=true"
Thread dump
Run this command for a thread dump:
jstack -l $(jcmd | grep -i 'controlcenter\.ControlCenter' | awk '{print $1}') > jstack.out
Data directory
The Control Center local state is stored in confluent.controlcenter.data.dir.
You can use this command to determine the size of your data directory (<data.dir>).
du -h <data.dir>